Search Engine Position Report: How to Build One from Google Search Console
A search engine position report turns Google Search Console data into a clear answer: what changed, which pages or queries caused it, and what should happen next.
This kind of reporting is exactly what SEO teams automating GSC reporting need to turn raw data into action.
I am Salam Qadir, Product and Growth Lead at Keytomic. I have worked in SEO and digital marketing for more than seven years across SaaS products, service businesses, and content operations. I have built and reviewed reporting workflows for people who need more than a ranking number. They need to know whether search visibility is creating useful visits, whether important pages are slipping, and what the team should do next.
Updated September 10, 2026: I refreshed this guide with current Google Search Console definitions, a practical position-report template, query and page analysis prompts, reporting formulas, E-E-A-T safeguards, and answers to the questions people commonly ask before sending an SEO report. I do not promise rankings. I show you how to make a report more honest and more useful.
This guide is based on Google’s public Search Console documentation and practical reporting experience. A third-party tracker can add daily rank checks, but Search Console remains the source for the clicks, impressions, CTR, and average position Google recorded for your property. Always check the official Google explanation of impressions, clicks, and position when a metric looks surprising.
What is a search engine position report?
A search engine position report is a stakeholder-ready summary of ranking and search-performance data for a defined website, query set, country, device, and date range. A useful report normally includes clicks, impressions, CTR, average position, landing page, query, movement against a comparison period, and recommended actions.
It is not the same as a rank tracker export. A rank tracker answers, “Where did this keyword appear when it was checked?” A position report answers, “What changed in our search visibility, why does it matter, and what are we doing about it?”
That difference is the information gain. A table of 500 keywords is data. A report that identifies three pages losing non-branded clicks, explains the likely causes, and assigns next actions is analysis.
Quick answer: what belongs in the report?
Report layer | Include | Why the reader needs it |
|---|---|---|
Executive summary | Clicks, impressions, CTR, position, winners, losers, actions | Explains the business story in under 90 seconds |
Query analysis | Query, clicks, impressions, CTR, average position, intent | Shows what people searched and where opportunity exists |
Page analysis | URL, clicks, impressions, CTR, position, page type | Connects movement to content that can be improved |
Segments | Brand, non-brand, device, country, search type | Prevents blended averages from hiding the real change |
Next actions | Owner, action, priority, expected signal, review date | Turns reporting into an operating system |
What does average position mean in Google Search Console?
Average position is the average of the topmost position occupied by your property for each impression. It is not a live rank, a guaranteed position, or an average of every link from your site on the results page. Google explains that the reported position can vary by query, device, location, result type, and whether the user actually saw the result.
For example, a page might appear in position 3 for one impression and position 11 for another. The report may show an average position of 7. A site-wide position of 12 could also hide one page at position 2 and many pages at positions 30 to 60. That is why I never headline a report with average position alone.
Read position alongside clicks, impressions, CTR, query, page, country, and device. If impressions rise because new pages begin appearing at position 50, the overall average may fall while the site is expanding its search coverage. That is not automatically a failure.
Search Console metrics, formulas, and common misreads
Metric | Formula or source | What I use it for | What not to assume |
|---|---|---|---|
Clicks | Google Search Console | Actual visits from Google Search | More clicks always mean higher rankings |
Impressions | Google Search Console | How often a result was shown or recorded | Every impression was actively noticed by a person |
CTR | Clicks divided by impressions | How well a result earns the click | One site-wide CTR describes every query |
Average position | Google’s averaged topmost result position | Directional movement for a defined segment | It is the exact rank a user sees today |
Change in clicks | Current period minus prior period | Traffic movement in absolute terms | A percentage change is reliable with tiny baselines |
CTR change | Current CTR minus prior CTR | Snippet and SERP-feature diagnosis | Low CTR always means the title is bad |
Search Console also has privacy filtering and data limits. Query tables are not a complete record of every search. Do not describe an exported query table as the full universe of searches for the site. Use language such as “top reported queries” and document the export date.
How to build a search engine position report step by step
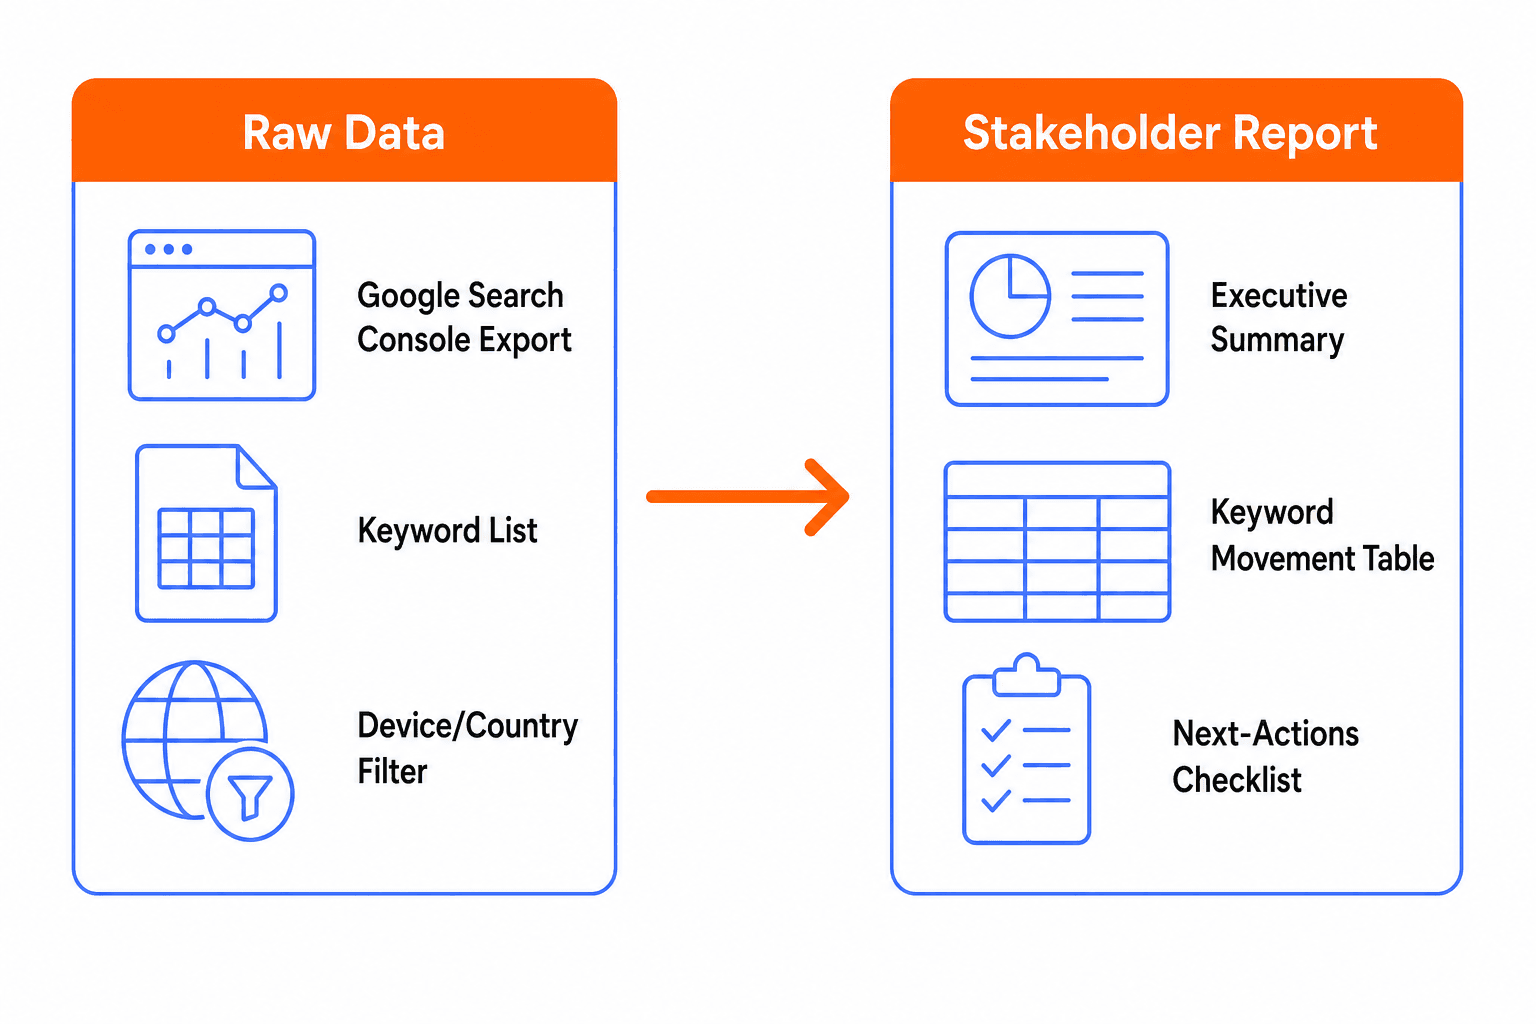
1. Define the decision before opening Search Console
Start with the decision the reader needs to make. “Did SEO work?” is too vague. Better questions are: Which non-branded pages lost qualified clicks? Which commercial queries sit on page two? Did mobile CTR fall after a template change? Which content cluster gained impressions but not visits?
2. Choose a comparison period that is actually comparable
Use the last 28 complete days versus the previous 28 days as a default. For seasonality, compare the same period last year. Avoid calling the newest two or three days final if your property still shows incomplete data. Write the date range, comparison range, property type, search type, country, and device in the report header.
3. Pull the correct Search Console property
Confirm whether you are using a Domain property or a URL-prefix property. Check that the protocol, subdomain, and folder scope match the question. A position report built from the wrong property can look precise and still be useless.
4. Separate branded and non-branded queries
Create separate views for queries containing your company or product name and queries that do not. Branded terms often rank highly and can make overall visibility look healthier than non-branded acquisition. This one split prevents many bad conclusions.
5. Group by page and search intent
Map queries to landing pages and label them informational, commercial, transactional, navigational, or local where relevant. A ranking change for a pricing page should not be blended with a ranking change for an educational article. Grouping by intent shows whether the change affects awareness, evaluation, or conversion.
6. Segment by device and country when the business needs it
Mobile and desktop results can behave differently. So can the United States, the United Kingdom, Australia, and a specific city. If the site sells or serves one geography, report that geography rather than celebrating global impressions that do not represent the target market.
7. Find meaningful winners and losers
Prioritize pages and queries using a blend of movement, impressions, clicks, business value, and recoverability. A query moving from position 55 to 35 may be a meaningful content opportunity even though it did not generate many clicks yet. A high-volume page dropping from position 4 to 9 deserves immediate inspection.
8. Explain the change and assign the next action
For each major movement, record the evidence, the likely explanation, the action, the owner, and the review date. Use “likely” when you have not tested the cause. Search Console can show that a page changed. It usually cannot prove whether the cause was an algorithm update, competitor improvement, technical issue, seasonality, or a content change without additional investigation.
How to interpret common Search Console patterns
Pattern | Likely question | First action |
|---|---|---|
Impressions up, clicks flat | Are new queries low-ranking, or is CTR falling? | Break down by query, page, position band, and SERP type |
Clicks down, impressions flat | Did CTR fall or did the result move lower? | Compare title, snippet, rich-result eligibility, and position |
Clicks and impressions down | Is there a ranking, indexing, demand, or technical issue? | Inspect affected URLs, queries, dates, and indexing reports |
Average position down, clicks up | Did new pages add lower-ranked impressions? | Compare established pages against newly visible pages |
Page position up, conversions flat | Is the query set mismatched with business intent? | Review landing-page intent, CTA path, and conversion tracking |
One page ranks for many similar queries | Is the page a strong hub or a cannibalization risk? | Map intent, consolidate overlap, and improve internal links |
These are diagnostic starting points, not automatic explanations. I would never tell a client “Google penalized us” from one chart. I would first check the affected pages, query mix, indexing status, device, country, seasonality, recent releases, and competitor results.
A practical search engine position report template
Use this structure in a Google Doc, Notion page, spreadsheet, or reporting tool. Replace the brackets with your data and write the summary only after checking the underlying rows.
Markdown prompts to analyze Search Console position reports
These prompts are designed to work with a CSV export or pasted Markdown table. Remove personal, customer, and commercially sensitive data before sending it to an AI tool. An AI assistant can summarize patterns, but it cannot validate a cause that is not present in the data.
Prompt 1: executive summary
Prompt 2: find page-two opportunities
Prompt 3: explain CTR problems
Prompt 4: diagnose losing pages
Prompt 5: turn movements into a 30-day plan
Prompt 6: client-safe report review
How E-E-A-T makes a position report more credible
E-E-A-T is not a box to tick with generic author text. For this topic, it means showing who interpreted the data, how the method works, which evidence supports the claims, and where uncertainty remains.
Experience: Include the reporting workflow you actually use, screenshots or examples you are allowed to share, and the decisions that followed the analysis. Do not invent a case study or claim a tool was used for years if it was not.
Expertise: Define Google’s metrics accurately, show formulas, explain segmentation, and distinguish observation from diagnosis.
Authoritativeness: Link metric definitions and indexing guidance to Google Search Console documentation. Cite the original source instead of repeating an unsourced SEO statistic.
Trust: Show the date range, property scope, filters, data status, limitations, author identity, and correction date. Be explicit that rankings and traffic are not guaranteed.
For a report about a real business, also connect search data to qualified leads, sales, sign-ups, or revenue where measurement allows. Clicks are useful, but clicks without intent and conversion context can reward the wrong work.
Common mistakes that weaken ranking reports
Leading with site-wide average position: It is too blended to explain what happened.
Calling Search Console a live rank tracker: It reports averages over a date range, not one universal rank.
Mixing brand and non-brand: The report hides acquisition performance behind brand demand.
Using incomplete dates: Recent data may change as Google processes it.
Reporting keywords without URLs: The team cannot tell which page should be improved.
Ignoring intent: A page can rank for a query that is visible but commercially irrelevant.
Listing changes without actions: A report that ends with observations creates no operating momentum.
Letting AI overstate the cause: Use AI for pattern detection and drafting, then verify the recommendation manually.
Position report versus dashboard versus rank tracker
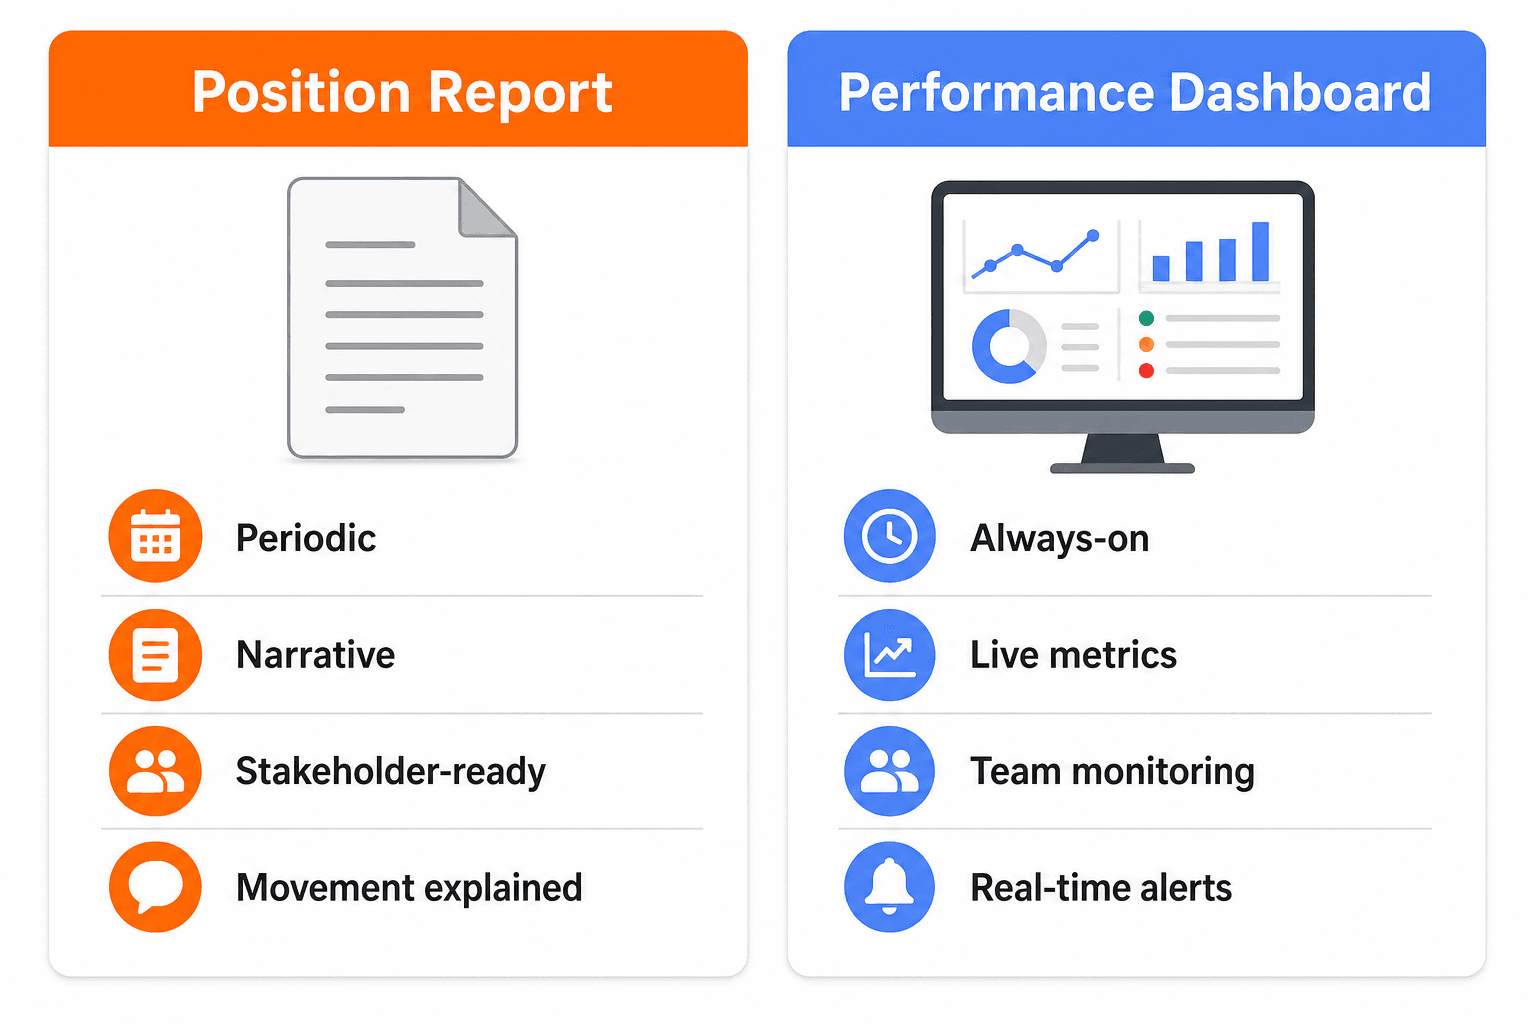
Asset | Main job | Best audience | Cadence |
|---|---|---|---|
Rank tracker | Monitor selected keywords at a configured location and time | SEO operators | Daily or weekly |
Search Console dashboard | Monitor first-party Google search performance | SEO and growth teams | Always on |
Position report | Explain movement and decide next actions | Founders, clients, marketing leaders | Monthly or quarterly |
Use the dashboard to spot a change, the rank tracker to inspect selected terms, and the report to explain what matters. They support each other, but they are not interchangeable.
Where AI SEO software fits into the workflow
Reporting quality depends on the workflow that feeds it. If topics were chosen without intent, pages were published without clear targets, or URLs were never connected to a content plan, the position report will be harder to interpret.
Keytomic’s AI seo software connects keyword discovery, topical planning, content production, publishing, indexing, and visibility measurement. I see that as an upstream workflow benefit, not a replacement for Search Console. The source of truth for Google clicks, impressions, CTR, and average position is still Google’s own data.
If the reporting problem begins with topic selection, review AI keyword research. If pages are disconnected, use a SEO topical map generator. If publishing is the bottleneck, see autoblog publishing. A technical SEO audit helps separate ranking problems from crawl and page-health problems, while the AI visibility tracker measures a separate search surface from Google position data.
When I compare AI seo software, I ask whether it makes the next report easier to explain, not whether it produces the longest feature list. Check the Keytomic pricing page and integrations page for current scope before deciding.
Pre-send checklist
Correct Search Console property and URL scope confirmed.
Current and comparison periods are complete and clearly labeled.
Branded and non-branded queries are separated.
Clicks, impressions, CTR, and average position are shown together.
Query movements include the associated landing page and intent.
Important device and country segments are reviewed.
Top winners and losers are manually spot-checked.
Observed facts are separated from hypotheses.
Each recommendation has an owner, priority, and review date.
The report states data limitations and does not promise rankings.
People Also Ask: search engine position report questions
How do I create a search engine position report in Google Search Console?
Open the Search results performance report, choose a complete date range and comparison period, export queries and pages with clicks, impressions, CTR, and average position, then segment the data by brand, page, intent, device, and country. Add a plain-English summary and next actions.
What is a good average position in Google Search Console?
There is no universal good average position because the number blends queries, pages, devices, locations, and impressions. Use query-level and page-level trends. For many businesses, movement into positions 1 to 10 is useful, but commercial value and clicks matter more than an isolated site average.
Why did average position drop while clicks increased?
New pages or queries may have started receiving impressions at lower positions, pulling the blended average down while established pages generated more clicks. Compare existing pages with newly visible pages before calling the change a loss.
How often should I send an SEO position report?
Use weekly internal checks for active campaigns, monthly reports for most clients and leaders, and quarterly reviews for content clusters and strategic trends. Keep the date range consistent and avoid presenting the newest incomplete data as final.
Is Google Search Console enough for a ranking report?
Search Console is enough for a first-party report on Google clicks, impressions, CTR, average position, pages, and queries. A rank tracker can add daily checks, controlled locations, competitor terms, and SERP features. Use both when those extra controls affect the decision.
What should a monthly SEO ranking report include?
Include an executive summary, comparison-period metrics, winners and losers, page and query tables, brand versus non-brand splits, important device or country segments, technical or indexing notes, and three prioritized actions with owners and review dates.
How can I improve rankings using a position report?
Find high-impression queries and pages in positions 8 to 20, verify search intent and the live SERP, improve the page where evidence supports it, strengthen internal links, resolve indexing or technical issues, and measure the same segment again after a reasonable period.
Can AI analyze my Search Console report?
Yes. AI can summarize movements, find page-two opportunities, classify patterns, and draft actions from a clean export. It should not invent causes, expose private data, call average position a live rank, or replace manual review of the affected pages and SERPs.
Final takeaway
A search engine position report should help someone make a decision, not simply admire a chart. Define the question, choose comparable periods, pull the right Search Console property, separate brand from non-brand, group by page and intent, explain uncertainty, and end with owned actions.
The best report is honest about what the data proves and useful about what the team should do next. If you want the upstream content workflow to be easier to connect to reporting, explore AI seo software, then validate its outputs against first-party Search Console data.